Sessions & analytics
Every conversation, in full — plus where your usage is actually going.
Once characters are live, most of your time in the panel is spent here. Sessions tell you what was said and why an answer went wrong; Analytics tells you which character is busy and which model is eating the allowance.
Sessions — the transcripts
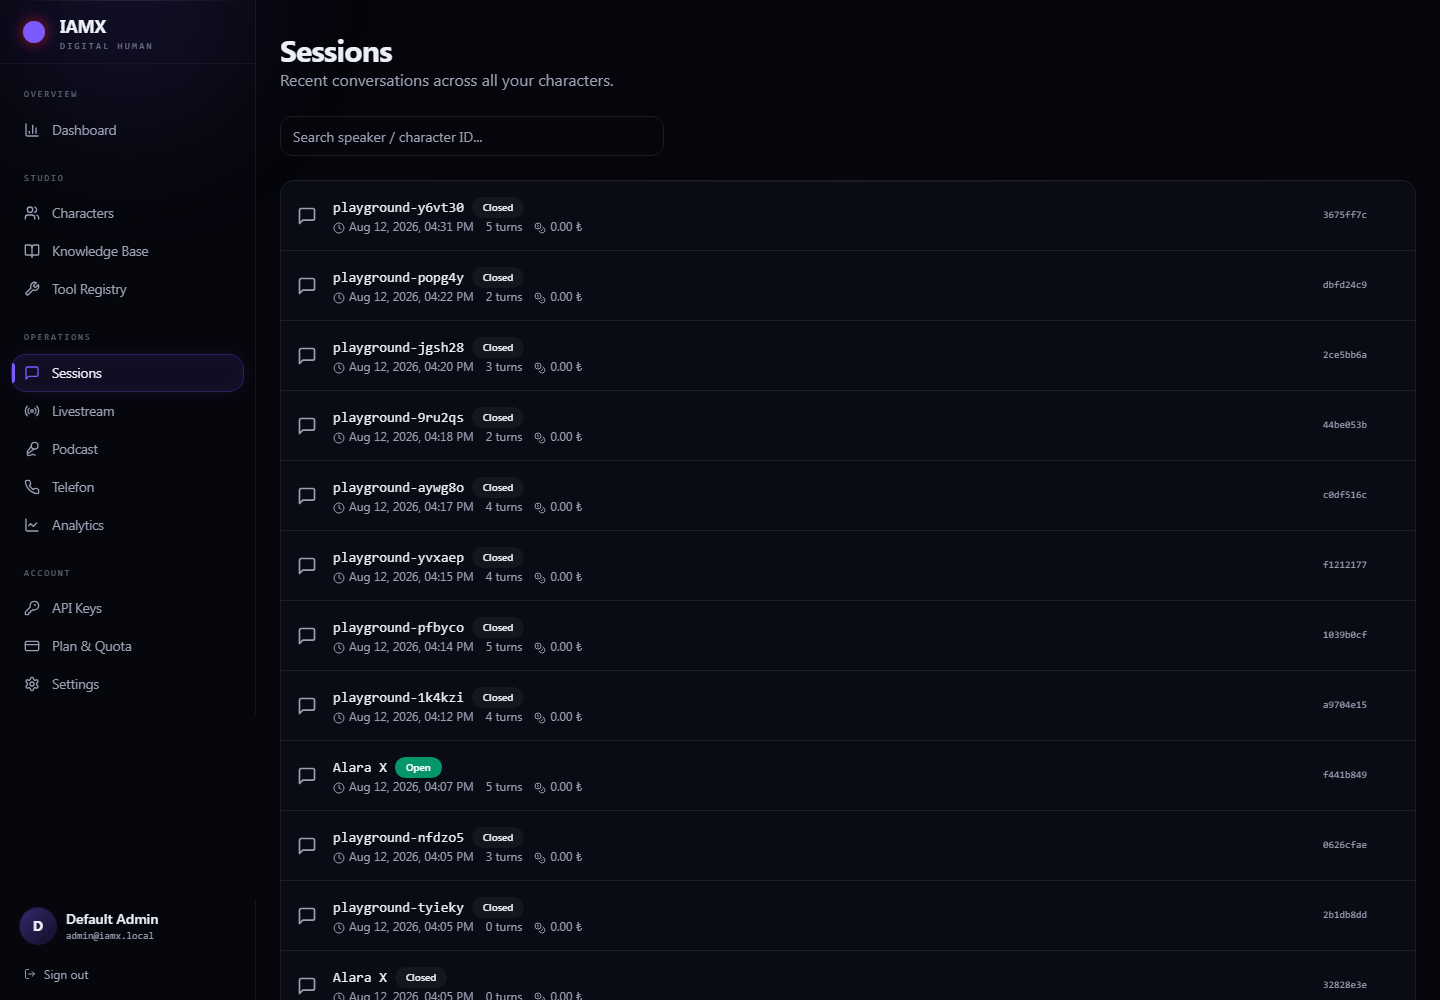
Each row is one conversation — a website visitor, a kiosk user, a phone caller or a live-stream viewer. Open means it is happening right now; Closed means it finished.
Opening a session gives you the whole exchange: what the visitor said, what the character replied, when, how many tokens each turn used, and — where audio was involved — a play button so you can hear exactly what the character sounded like. Where the character used a tool, the call it made is shown inline.
The search box matches speaker and character identifiers rather than names, so the usual route is to sort by time and open the conversation you are investigating.
Analytics — where the usage goes
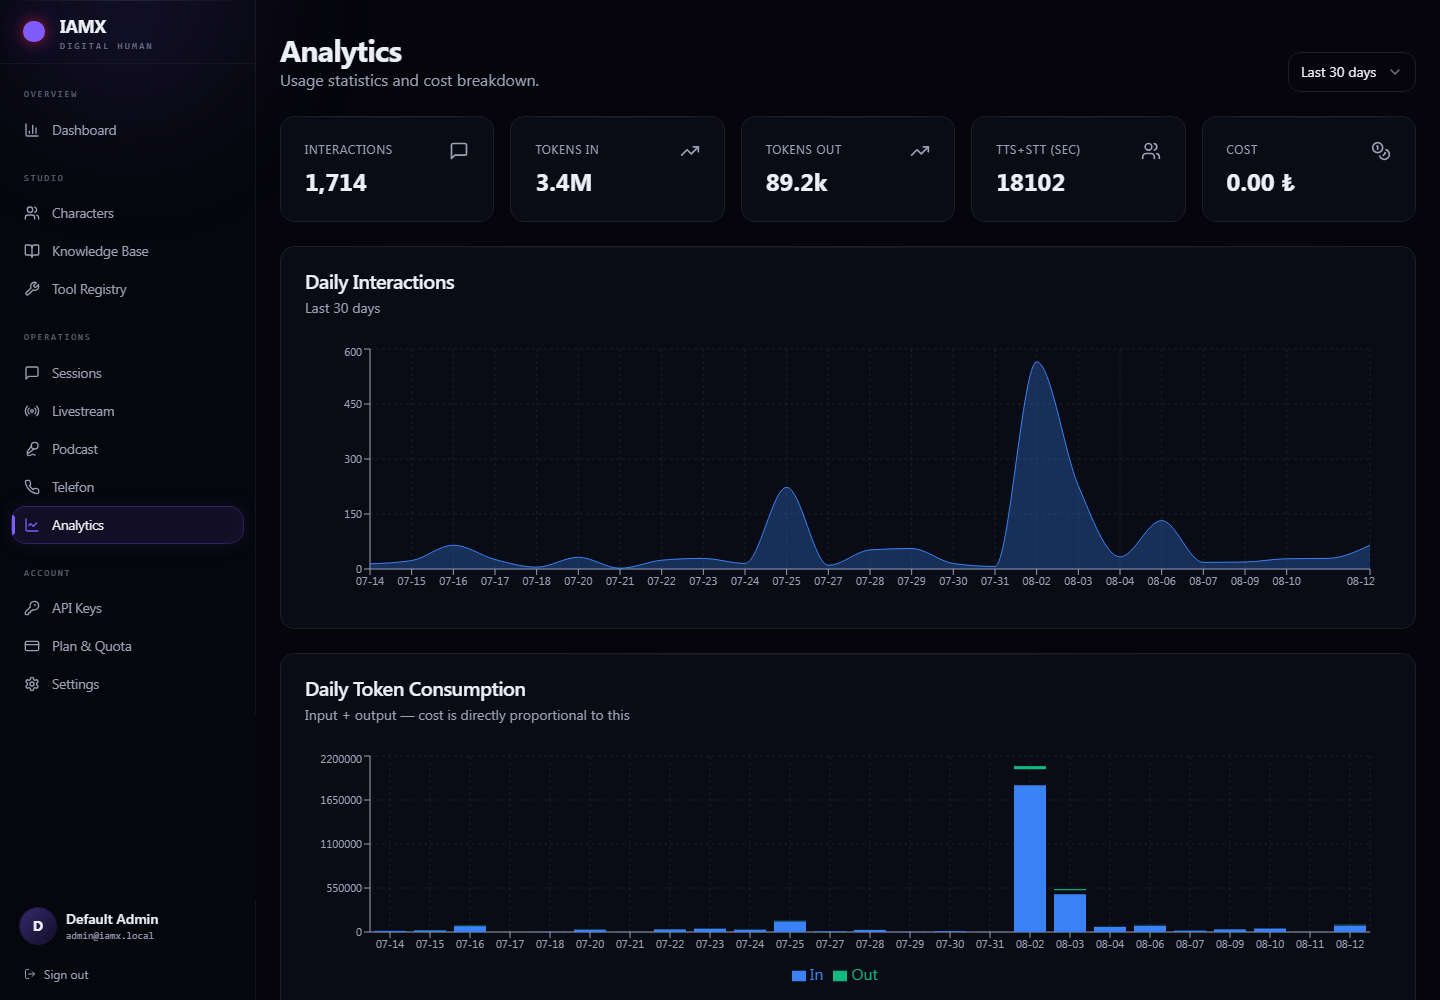
| Panel | What it tells you |
|---|---|
| Interactions | How many turns were served in the period. |
| Tokens in / out | The volume of text going into and coming out of the model. This is the truest measure of load. |
| Speech seconds | Audio generated and transcribed. |
| Daily interactions | Your traffic shape — when your characters are actually busy. |
| Daily tokens | Input against output. A big input number usually means a lot of documents are being retrieved. |
| By character | Which of your characters is carrying the traffic. |
| By model | Which models are being used, and how heavily. |
Tool execution log
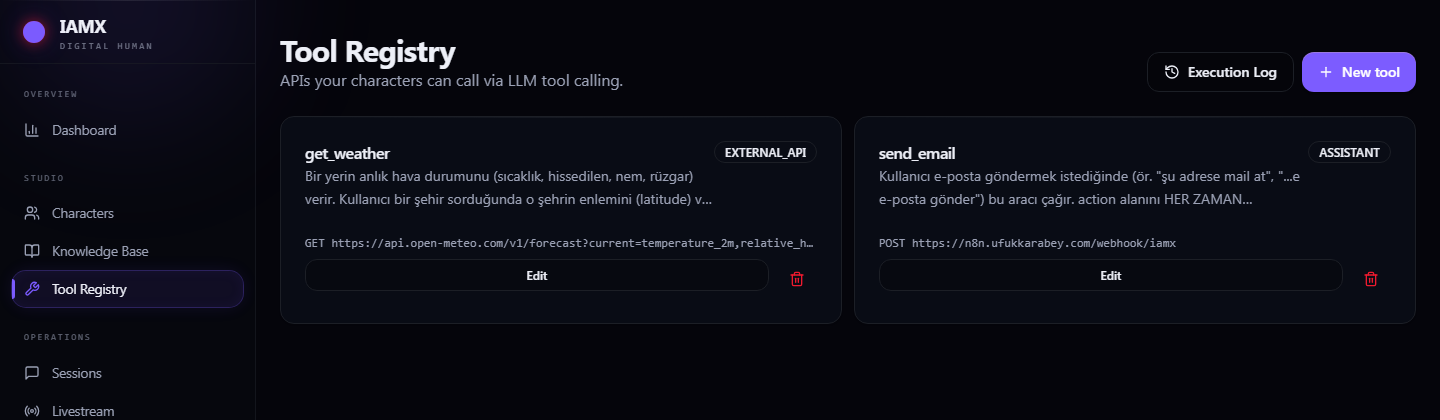
If your characters perform actions — sending mail, checking balances, calling your API — the execution log is the record of what was called, by which character, on whose behalf, and with what arguments. Each row links back to the conversation that triggered it, so you can read the exchange that led to the action.
A weekly routine that catches most problems
- Open Analytics on 7 days. Look for a spike or a collapse in daily interactions — both mean something changed.
- Check Plan & Quota. If a bar is heading for amber before the month is out, look at which character and model are responsible on the Analytics breakdowns.
- Read five random sessions. Not the complaints — random ones. It is the most reliable way to notice a character that has quietly started answering badly.
- Skim the execution log for failed actions.